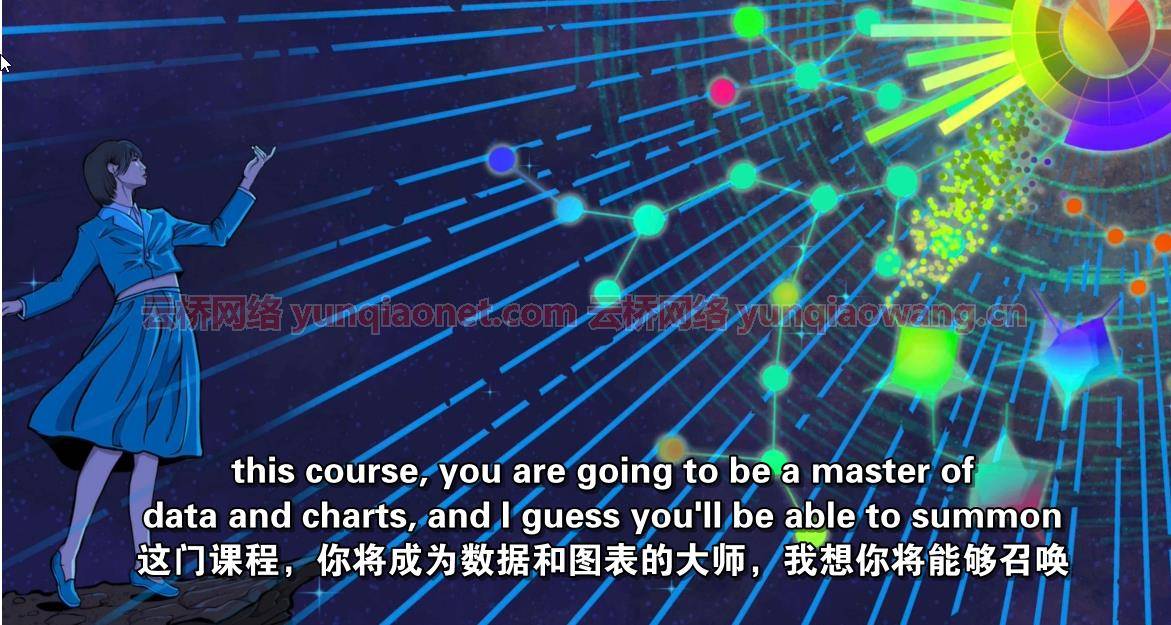
征服熊猫、马特洛特利布、海鸟等等。处理数十个数据集!
你会学到什么
熊猫大师数据帧和系列
使用Seaborn创建美丽的可视化效果
分析几十个真实数据集
通过大量的练习和挑战来练习
了解Matplotlib的来龙去脉
MP4 |视频:h264,1280×720 |音频:AAC,44.1 KHz,2 Ch
语言:英语+中英文字幕(云桥网络 机译) |时长:199场讲座(20小时13分钟)|大小解压后:8.59 GB
要求
Python基础知识(变量、条件等)
描述
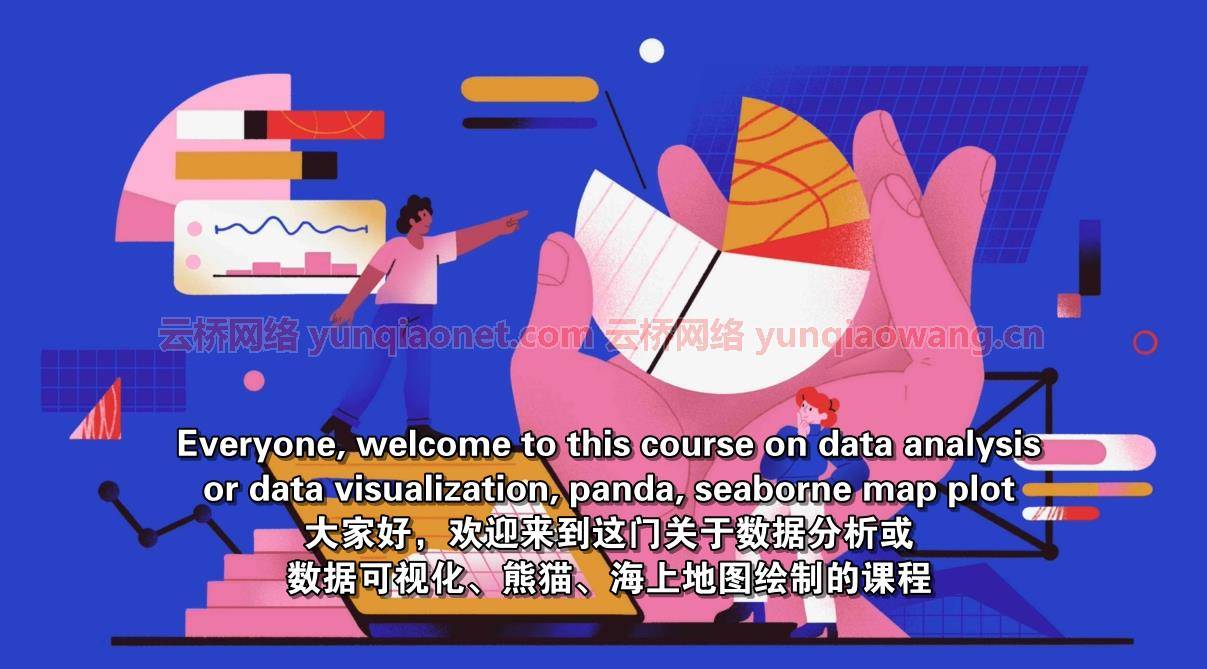
欢迎来到我认为是网上最好的熊猫、马特洛特利、西伯恩等课程!本课程旨在提升您的数据技能,以帮助您在数据科学、机器学习、金融等领域获得职业发展。
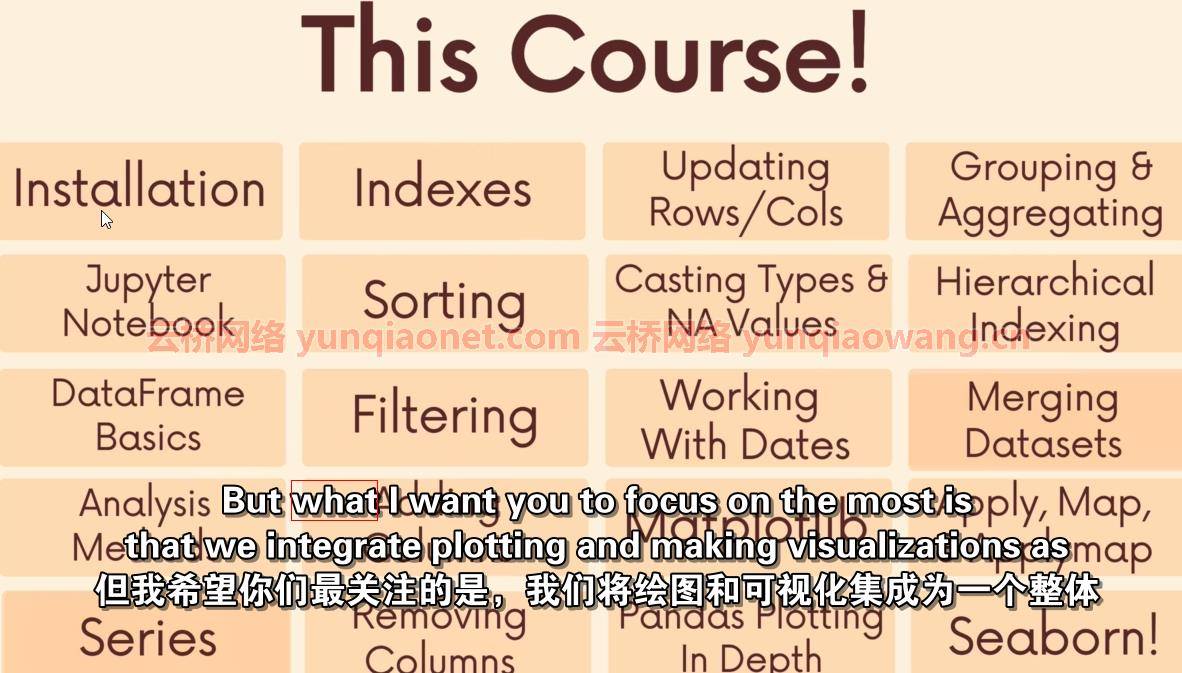
这是一门结构严密的课程,涉及面很广,但它都被分解成了真人大小的部分,而不是一个压倒性的参考手册,一下子把所有东西都扔给你。在每一个新话题之后,你将有机会练习你所学的内容,并通过练习和项目挑战自己。我们使用几十个有趣的真实数据集,包括亚马逊畅销书、里维安股票价格、总统推文、比特币历史数据和不明飞行物目击。
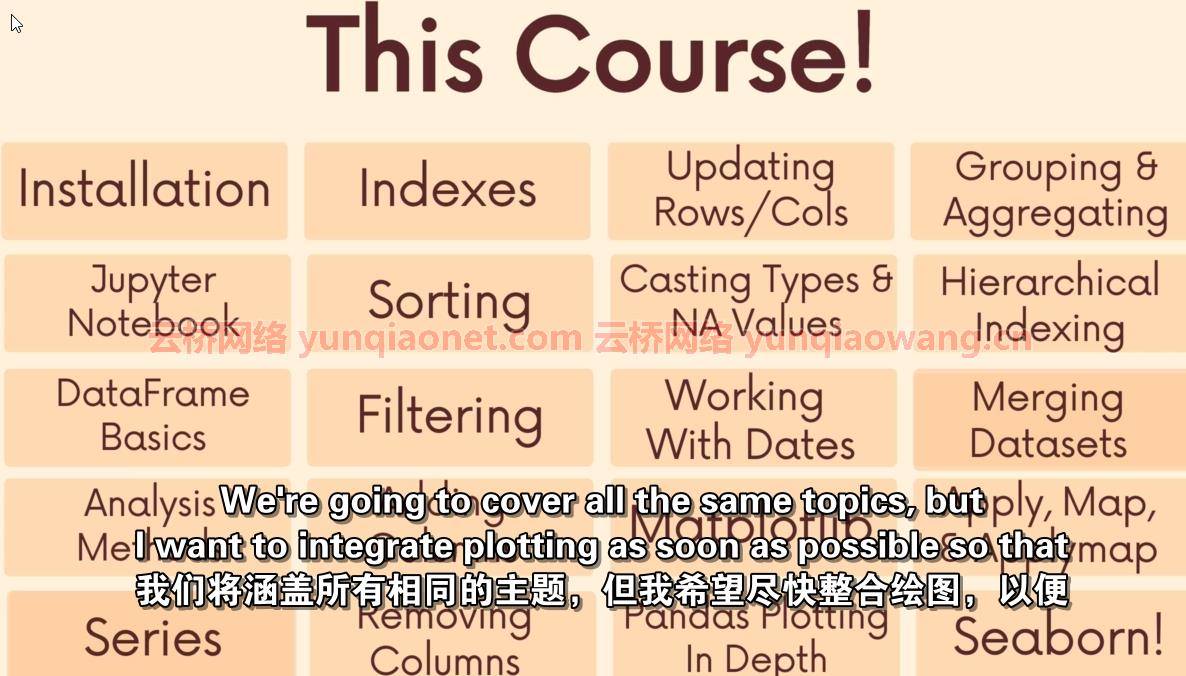
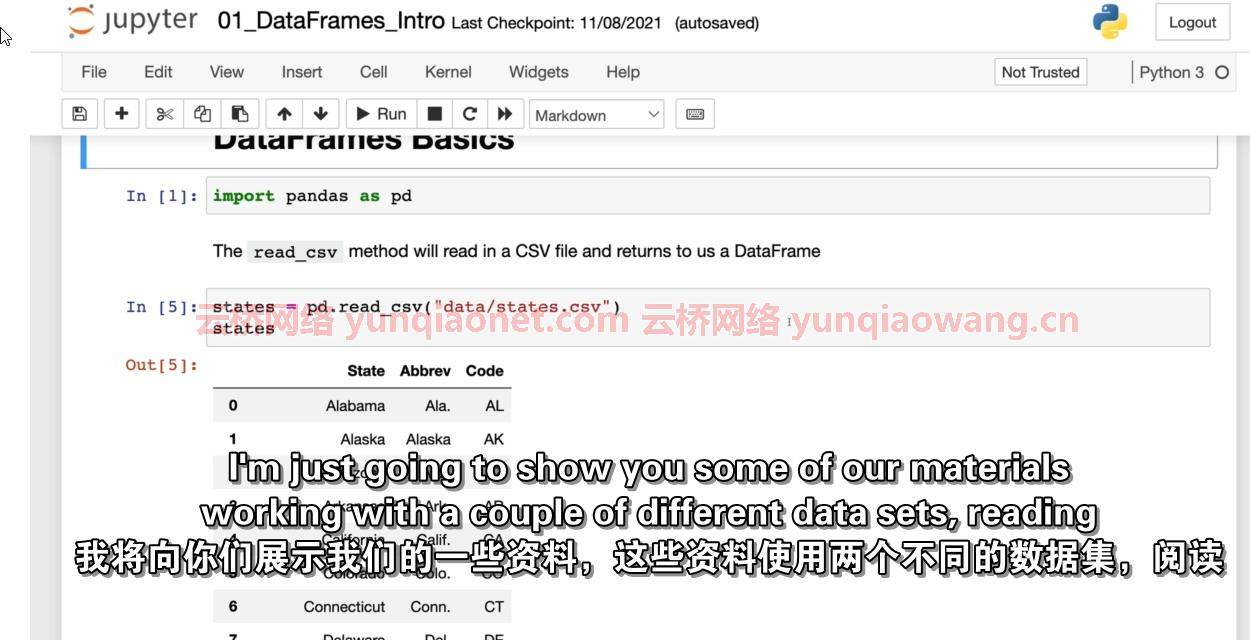
在进入熊猫必备品之前,我们先从Jupyter笔记本的基础知识和设置开始。然后,您将学习如何读入数据集、使用数据框和系列、组织、过滤、排序、清理、聚合和分析这些数据集。您将学习如何处理日期和文本信息,掌握机器索引,甚至将多个数据集合并在一起。
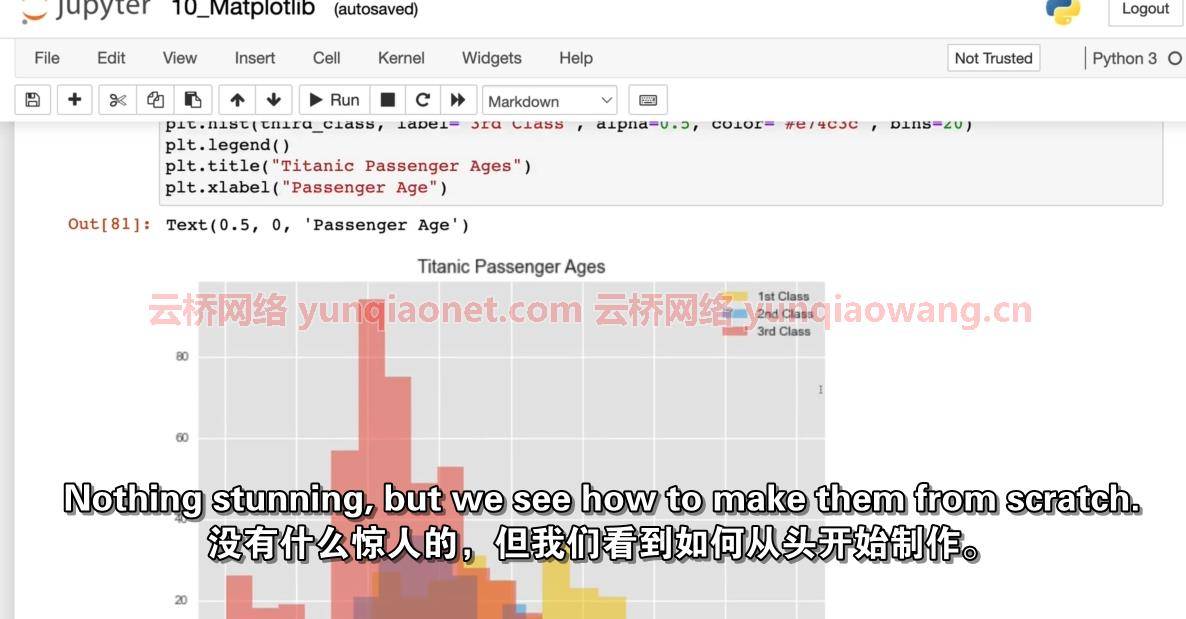
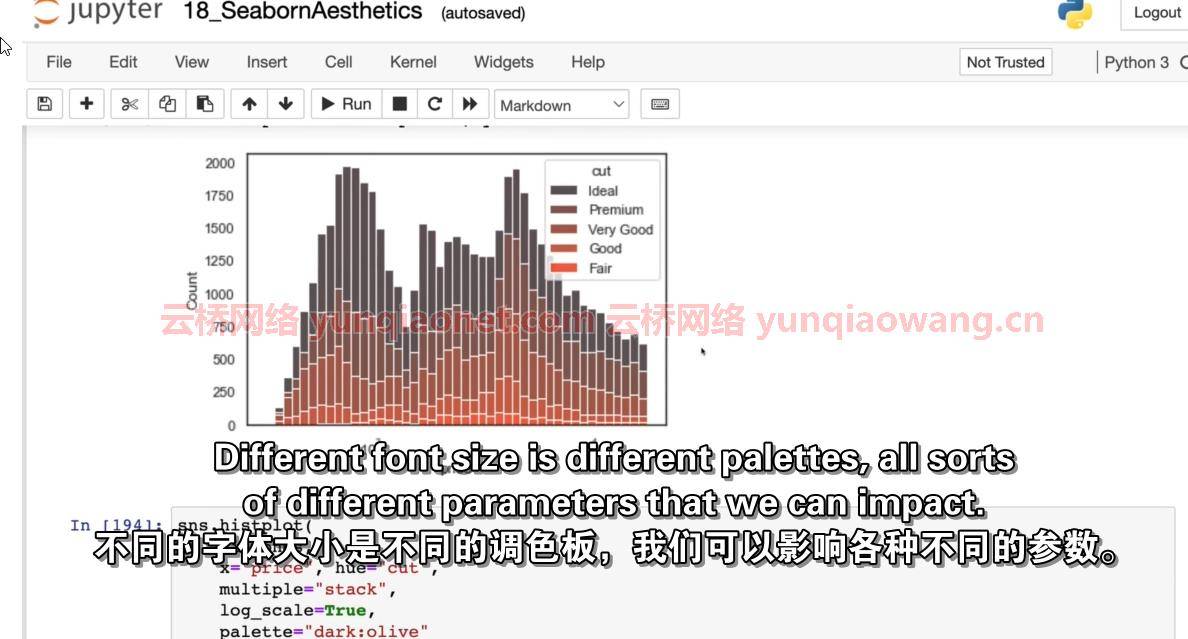
在整个课程中,你将使用matplotlib和Seaborn创建可视化。折线图、条形图、饼图、直方图、散点图、箱线图、蜂群图、小提琴图、带状图、点状图和复杂的子图布局!我们甚至将学习如何定制我们的花式情节的风格和外观,以创造真正引人入胜的视觉效果。
最棒的是,你不需要成为Python专家。如果你能处理变量、列表和条件,你就没事了!
无论你是在金融、数据科学、机器学习、网络开发领域工作,还是渴望在这些领域工作:你在这门课程中学到的技能都是必不可少的。当我说这是我做过的最喜欢的课程时,我不是在开玩笑。希望你也喜欢。
这门课是给谁的
初学Python的开发人员对数据分析、数据可视化或数据科学很好奇
MP4 | Video: h264, 1280×720 | Audio: AAC, 44.1 KHz, 2 Ch
Genre: eLearning | Language: English + srt | Duration: 199 lectures (20h 13m) | Size: 8.33 GB
Conquer Pandas, Matplotlib, Seaborn, and More. Work With Dozens of Datasets!
What you’ll learn
Master Pandas Dataframes and Series
Create beautiful visualizations with Seaborn
Analyze dozens of real-world datasets
Practice with tons of exercises and challenges
Learn the ins and outs of Matplotlib
Requirements
Basic Python Knowledge (variables, conditionals, etc)
Description
Welcome to what I think is the web’s best course on Pandas, Matplotlib, Seaborn, and more! This course aims to level up your data skills to help you grow your career in Data Science, Machine Learning, Finance, etc.
This is a tightly structured course that covers a ton, but it’s all broken down into human-sized pieces rather than an overwhelming reference manual that throws everything at you at once. After each and every new topic, you’ll have the chance to practice what you’re learning and challenge yourself with exercises and projects. We work with dozens of fun and real-world datasets including Amazon bestsellers, Rivian stock prices, Presidential Tweets, Bitcoin historic data, and UFO sightings.
We start with the basics of Jupyter notebook and setup before moving to Pandas essentials. Then you’ll learn how to read datasets in, work with DataFrames and Series, organize, filter, sort, clean, aggregate, and analyze those datasets. You’ll learn how to work with dates and textual information, master heirachical indexing, and even merge multiple datasets together.
And throughout the course you’ll create visualizations with matplotlib and eventually with Seaborn. Line, bar, pie charts, histograms, scatter plots, box plots, swarm, violin, strip, point plots, and complex subplot layouts! We’ll even learn how to customize the styles and appearance of our fancy plots to create truly engaging visualizations.
And the best part is that you don’t need to be an expert in Python. If you can work with variables, lists, and conditionals, you’ll be fine!
Whether you work in finance, data science, machine learnings, web development, or you aspire to work in those fields: the skills you learn in this course are essential. I’m not kidding when I say this is my favorite course I’ve ever made. I hope you enjoy it too.
Who this course is for
Beginner Python devs curious about data analysis, data visualization, or data science
云桥网络 为三维动画制作,游戏开发员、影视特效师等CG艺术家提供视频教程素材资源!
1、登录后,打赏30元成为VIP会员,全站资源免费获取!
2、资源默认为百度网盘链接,请用浏览器打开输入提取码不要有多余空格,如无法获取 请联系微信 yunqiaonet 补发。
3、分卷压缩包资源 需全部下载后解压第一个压缩包即可,下载过程不要强制中断 建议用winrar解压或360解压缩软件解压!
4、云桥网络平台所发布资源仅供用户自学自用,用户需以学习为目的,按需下载,严禁批量采集搬运共享资源等行为,望知悉!!!
5、云桥网络-CG数字艺术学习与资源分享平台,感谢您的赞赏与支持!平台所收取打赏费用仅作为平台服务器租赁及人员维护资金 费用不为素材本身费用,望理解知悉!